Research-grade vs Consumer-grade Photoplethysmography (PPG): What Researchers Should Know
Photoplethysmography (PPG) has become one of the most visible physiological signals in modern life – even if many people do not realize they are already using it. From smartwatches and fitness trackers to laboratory and clinical research settings, PPG is now a widely used method for monitoring pulse-related physiology.
Its growing popularity makes sense! PPG is non-invasive, relatively accessible, and capable of providing useful cardiovascular information in a wide range of settings. But as interest in wearable and optical sensing continues to grow, it is also worth asking an important question: what kind of information does PPG actually provide, and what are its limitations?
What Is PPG?
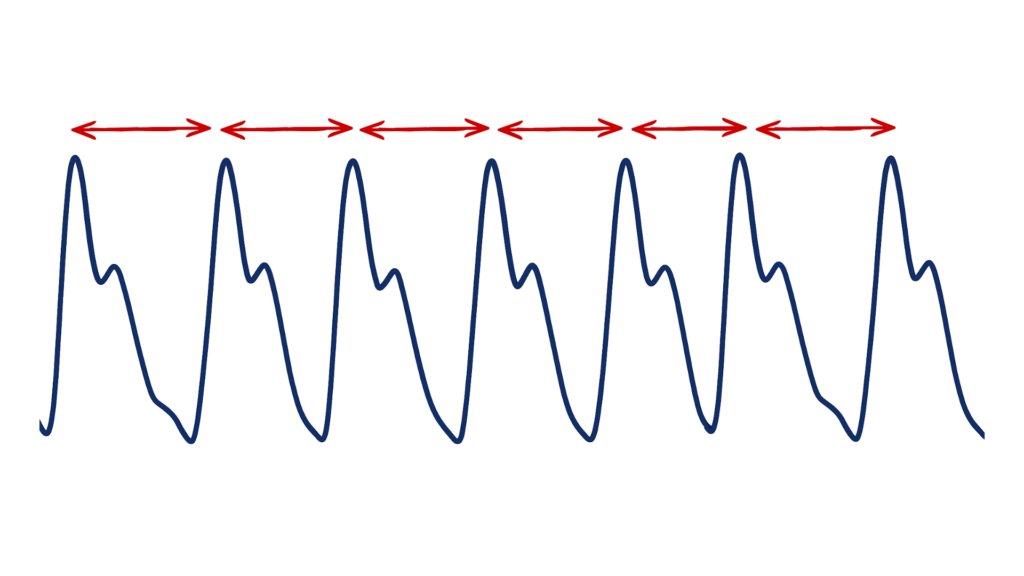
PPG is an optical technique used to detect changes in blood volume within tissue. In simple terms, a light source shines into the skin while a photodetector measures changes in the amount of light absorbed or reflected. Because blood volume changes with each heartbeat, the resulting signal forms a pulsatile waveform that can be used to track the arrival of the pulse wave at a peripheral site.
Depending on the device, PPG may be collected from locations such as the finger, ear, or wrist.
Why Is PPG So Widely Used?
One reason PPG has expanded so quickly is that it offers a practical balance of convenience and physiological insight. It can be used to estimate heart rate and pulse interval measures, and when paired with additional signals like Electrocardiogram (ECG), it can also support applications such as Pulse Transit Time (PTT).
In consumer technology, that accessibility has helped drive the growth of wearable health and fitness devices. In research settings, PPG can offer a flexible way to collect pulse-related data when optical sensing is appropriate for the question at hand.
PPG vs ECG: What Is The Difference?
PPG and ECG are often discussed side by side because both can be used to examine cardiovascular timing, but they are not measuring the same thing. ECG directly measures the heart’s electrical activity, while PPG measures the peripheral pulse wave by detecting blood volume changes in tissue.
That difference matters! PPG-derived Pulse Rate Variability (PRV) can be useful, but it should not automatically be treated as interchangeable with ECG-derived heart rate variability. Recent studies continue to show meaningful disagreement between PRV and HRV, and one large clinical-population study found that PRV significantly underestimated HRV in that dataset (Kantrowitz et al., 2025; Mejía-Mejía et al., 2020).
Because ECG directly captures cardiac activation, it remains the preferred method when high temporal precision is required, especially for more rigorous HRV analyses. PPG remains appealing, however, because it is easier to deploy in many contexts and can still provide valuable cardiovascular information when used appropriately.
Consumer-grade vs Research-grade PPG
Consumer wearables have made PPG more visible and more available than ever before. That accessibility is a major advantage, especially for broader monitoring and real-world data collection.
At the same time, not all PPG systems are created equal.
The usefulness of a PPG signal depends heavily on factors such as sampling rate, sensor placement, motion sensitivity, access to raw data, as well as how the device handles filtering and artifact correction behind the scenes. A polished user experience does not necessarily mean the underlying data is suitable for every research or interpretive purpose.
As optical sensing becomes more common, the challenge is no longer just access to physiological data – it is understanding the quality, assumptions, and limitations built into the devices collecting it. That distinction becomes especially important when pulse-based metrics are discussed as if they are interchangeable with ECG-derived measures.
Learn More At Our Upcoming Webinar!
As interest in optical sensing continues to grow, so does the need for clearer conversations about what PPG can and cannot tell us.
Our upcoming webinar will take a closer look at photoplethysmography, including how to clean and analyze PPG, a deeper dive on how PPG compares with ECG, and how PTT can be derived when collecting these measures in tandem.
References
Alian, A. A., & Shelley, K. H. (2014). Photoplethysmography. Best Practice & Research Clinical Anaesthesiology, 28(4), 395–406.
Allen, J. (2007). Photoplethysmography and its application in clinical physiological measurement. Physiological Measurement, 28(3), R1–R39.
Bent, B., Goldstein, B. A., Kibbe, W. A., & Dunn, J. P. (2020). Investigating sources of inaccuracy in wearable optical heart rate sensors. NPJ Digital Medicine, 3(1), 18.
Cacioppo, J. T., Tassinary, L. G., & Berntson, G. G. (2017). Handbook of Psychophysiology (4th ed., pp. 198–199). Cambridge University Press.
Elgendi, M. (2012). On the analysis of fingertip photoplethysmogram signals. Current Cardiology Reviews, 8(1), 14–25.
Kantrowitz, A. B., Ben-David, K., Morris, M., Wittels, H. L., Wishon, M. J., McDonald, S. M., … & Wittels, S. H. (2025). Pulse rate variability is not the same as heart rate variability: Findings from a large, diverse clinical population study. Frontiers in physiology, 16, 1630032.
Mejía-Mejía, E., Budidha, K., Abay, T. Y., May, J. M., & Kyriacou, P. A. (2020). Heart rate variability (HRV) and pulse rate variability (PRV) for the assessment of autonomic responses. Frontiers in physiology, 11, 779.